

Listening with headphones has become a part of daily life, so it’s important that headphones are designed with the basics in mind: sound quality, reliability, and safety. This can be harder than it sounds — unlike with a loudspeaker, it’s not possible to measure a headphone’s sensitivity using a free-field setup due to the speaker’s closeness to the ear. To account for this, acoustics engineers can turn to the COMSOL Multiphysics® software.
Designing Safer Headphones for Improved Listening Experiences
In a noisy world with more portable devices than ever before, headphone use is everywhere. Whether a listener prefers a wired set that goes over the ears or wireless ear buds, the listening experience should be comfortable; reliable; and, of course, safe. But as headphone use increases, so does the potential for permanent hearing loss. This is because of both the close proximity of the headphone to the ear, as well as the sensitivity of the inner ear.
Loud noises can cause damage to the sensitive internal ear — namely, the hair cells of the cochlea that allow for the transmission of electrical signals to the brain. When lost, these hair cells can’t grow back, resulting in permanent hearing loss. Because headphones are so close to our ears, they don’t have to be that loud to cause damage. Any noise over 85-dB SPL is considered harmful, but that’s only part of the issue: Prolonged noise exposure at much lower levels can also be dangerous and can cause permanent noise-induced hearing loss . A lot of devices can go up to much higher levels, about 120-dB SPL, and according to the American Osteopathic Association, that kind of range can damage hearing in as little as 15 minutes.
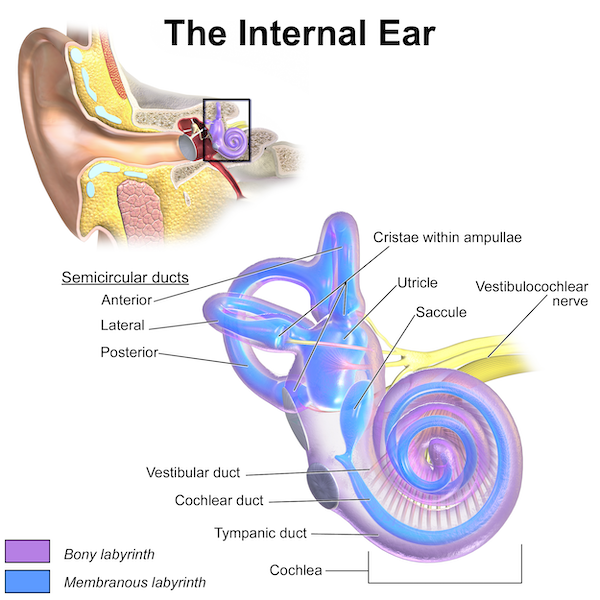
Anatomy of a human internal ear. Image by BruceBlaus, Blausen.com staff (2014). “Medical gallery of Blausen Medical 2014”. WikiJournal of Medicine 1 (2). DOI:10.15347/wjm/2014.010. ISSN 2002-4436 — Own work. Licensed under CC BY 3.0, via Wikimedia Commons.
Fortunately, acoustics engineers and designers of headphones, hearing aids, and other sound devices that go in or around the ears have developed safer listening methods. Noise-canceling headphones, for example, drown out surrounding noise so that users don’t have to crank up the volume just to hear music or a podcast, and some headphones include features such as the ability to set a customized maximum volume. The concept of sound quality is equally important. High-quality sound reproduction will typically limit the need for users to turn up the volume to get all of the details of the music being played.
However, designing safer headphones is not without its challenges: Due to the complexity of the human anatomy and the closeness of the headphone speaker to the ear, engineers cannot analyze and test its effects the same way that they would for a typical loudspeaker. For testing, engineers turn to the use of standardized artificial ears. To test new designs and concepts and reduce the number of prototypes, it’s helpful to turn to simulation to measure the performance of acoustics devices for the human ear. Much like a head and torso simulator, you can use multiphysics modeling to evaluate the realistic properties of acoustic devices on a human ear.
Modeling a Headphone on an Artificial Human Ear with COMSOL Multiphysics®
To accurately represent the usage conditions of the measurement setup, this model uses an artificial ear coupled to a circumaural headphone.
First, let’s focus on the ear part of the model geometry. The pinna (the external, visible part of the ear) is taken from a 3D scan of an actual human ear, and the ear canal (part of the middle ear) is shaped as a perfect cylinder, with the eardrum (leading to the inner ear) represented at the end of the canal. The impedance of the eardrum, specifically, is important for this simulation.
The acoustic domain represents three regions:
- Pressure chamber (blue)
- External domain (light blue)
- Perfectly matched layer (dark blue)
The speaker driver is added as a lumped equivalent (using the Electrical Circuit interface) so that it enforces a velocity on the diaphragm (yellow line). This causes a pressure drop across the diaphragm, and the pressure drop is then coupled back to the circuit. The perforated plates (green lines) connect the different chambers of the acoustic domain.
For the headphone component, the casing (gray) for our purposes is rigid, but if desired, it can also be modeled as an elastic structure. The Poroelastic Waves interface makes it possible to model the foam (red), which is fixed on the boundaries attached to the skin and headphone casing. The compression of the foam is not accounted for in this model due to its complexity, but the model gives you a good idea of how this setup would work in real life.
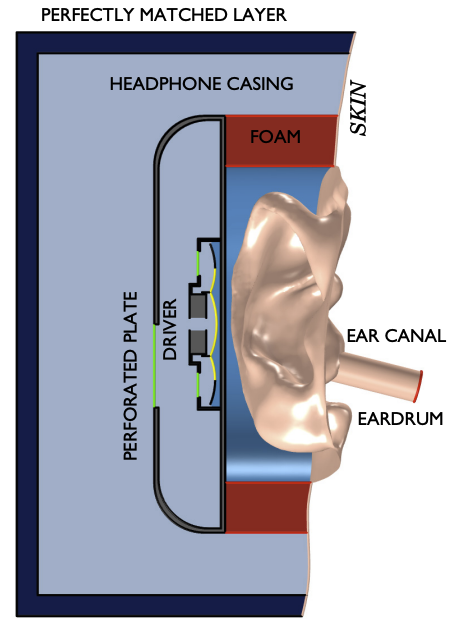
Schematic of the headphone on the ear model setup.
As you can see, the setup is fairly complex, so we recommend taking a lumped approach to model the driver. Many acoustics engineers are familiar with lumped representations of drivers — you may have already seen the Lumped Loudspeaker Driver model available in the Application Gallery, which uses a lot of the same parameters that characterize the low-frequency performance of a loudspeaker for the headphone and ear modeled here. (See the tutorial documentation for the exact parameters and conditions used to set up this headphone-on-ear model.)
It is, of course, also possible to model the transducer and its interaction in the headphone in full detail, coupling electromagnetic fields and vibrating structures. The transducer model can, for example, be based on the Loudspeaker Driver — Frequency-Domain Analysis model or for a miniature transducer example on the OW Microspeaker: Simulation and Correlation with Measurements model.
Finally, the boundaries for the realistic human skin impedance condition are shown below for the ear and eardrum.

Boundaries of the acoustic domain with skin impedance.
Evaluating the Simulation Results
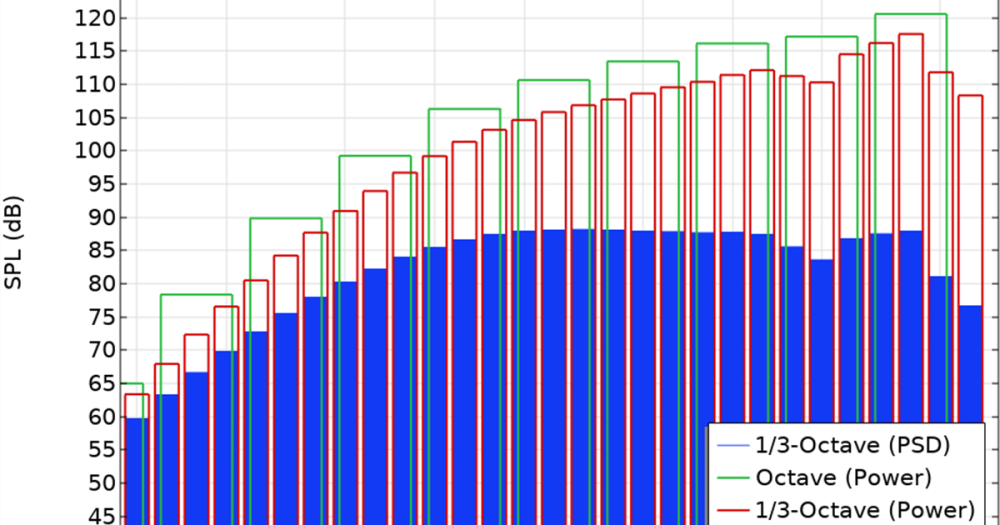
After setting up and solving the model, the first result to look at for a transducer simulation is typically the frequency response of the system; in this case, the sound pressure level (SPL) at the eardrum. This response is plotted in the image below (blue curve) together with the SPL measured 2 cm outside the headphone (green curve).
What you typically want to achieve is a response at the eardrum that matches the free-field listening experience, since this will be perceived as a natural sound experience. In this model, we are only considering the linear (small-signal) response of the system. The SPL at the eardrum curve is not flat, which is not necessary, since the free-field response at the ear is not a flat response.
Remember that the headphone model geometry and parameters are invented and not engineered. The purpose of the model is to show how to perform the analysis.
The response is influenced by different resonances above 500 Hz, and it also looks like the system is very open to the outside, which results in the roll-off below 500 Hz. If you look into the model, it turns out that the main leak is the foam (you can test that by changing the properties of the foam) and not the perforated plates/meshes in the model. The difference between the blue and green curve gives an indication of how good the soundproofing of the headphone is.
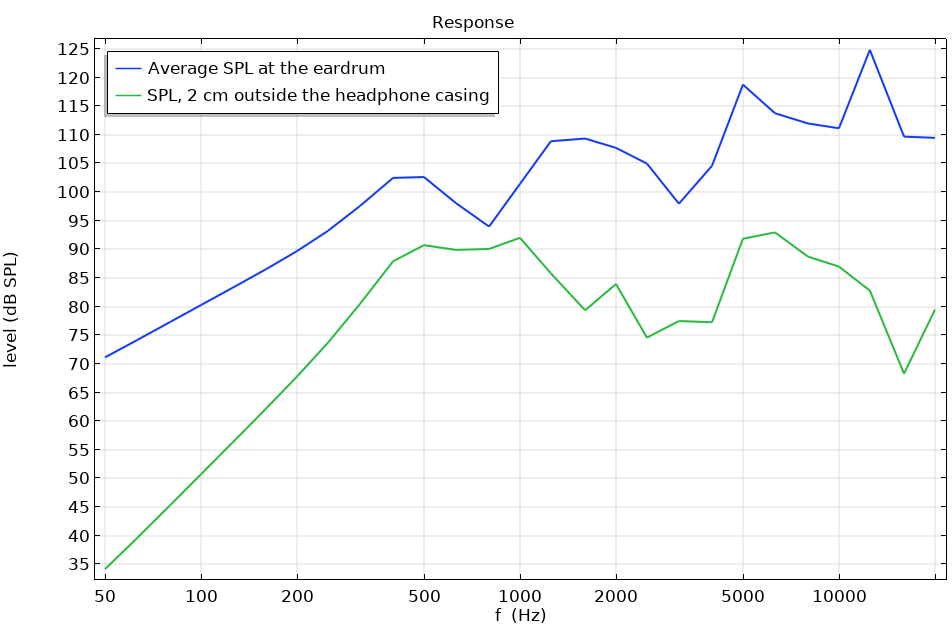
Response of the system measured at the eardrum (blue curve) and 2 cm outside the headphone (green curve).
One advantage of using simulation is that you can visualize the sound field; look inside the system where measurements can be difficult; and, for example, identify resonances. The SPL distribution at 5000 Hz is shown in the image below. A resonance (area with a low sound pressure level) is clearly seen in both the volume behind the speaker as well as in the volume between the headphone and the skin.
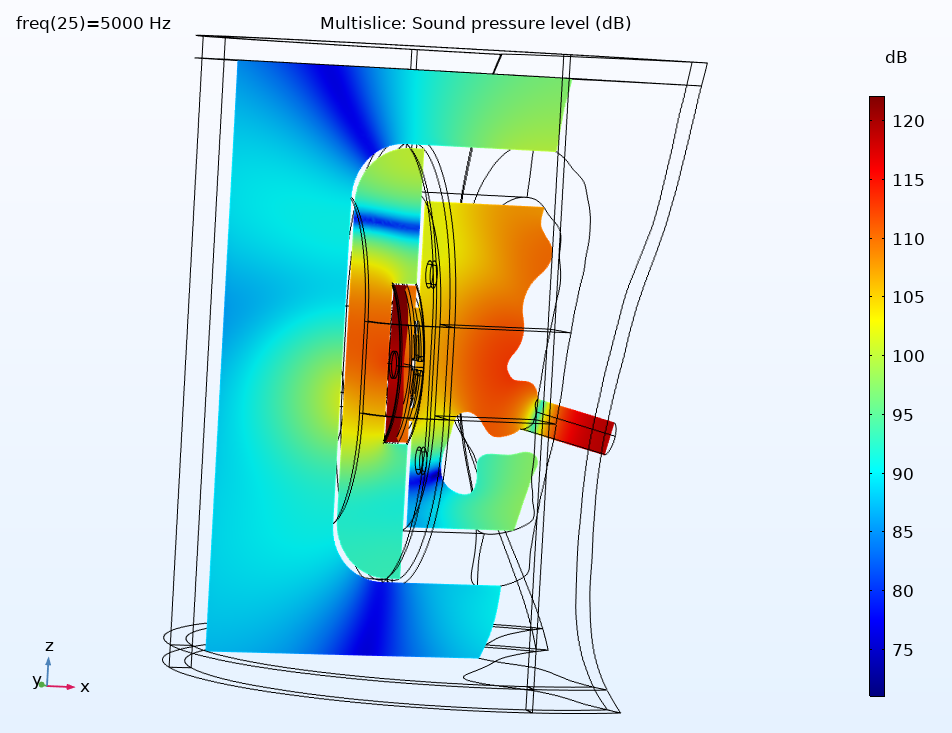
SPL distribution depreciation cross section at 5000 Hz.
You can also test new designs virtually, for example, by changing the porosity and design of the perforated mesh in the headphone. You may also want to add patches of porous materials to control resonances. Using simulation, you can also introduce leaks between the foam and skin and study their influence on the response. You can also visualize the SPL on the skin on and around the ear at different frequencies (images below). From these results, you can study the effect of the foam, which has damping properties that help shield the ear from exterior noise. Below, you can clearly see the effect of the foam at the lowest frequencies, where the foam has better damping properties.


Sound pressure level distribution on the skin and displacement of the foam at different frequencies.
By using simulation, designers can accurately measure a headphone speaker’s sensitivity close to a listener’s ear, helping them optimize the listening experience while minimizing risks to hearing health.
Next Steps
Click the button below to try out the Headphone on Artificial Ear model for yourself.


Comments (0)